
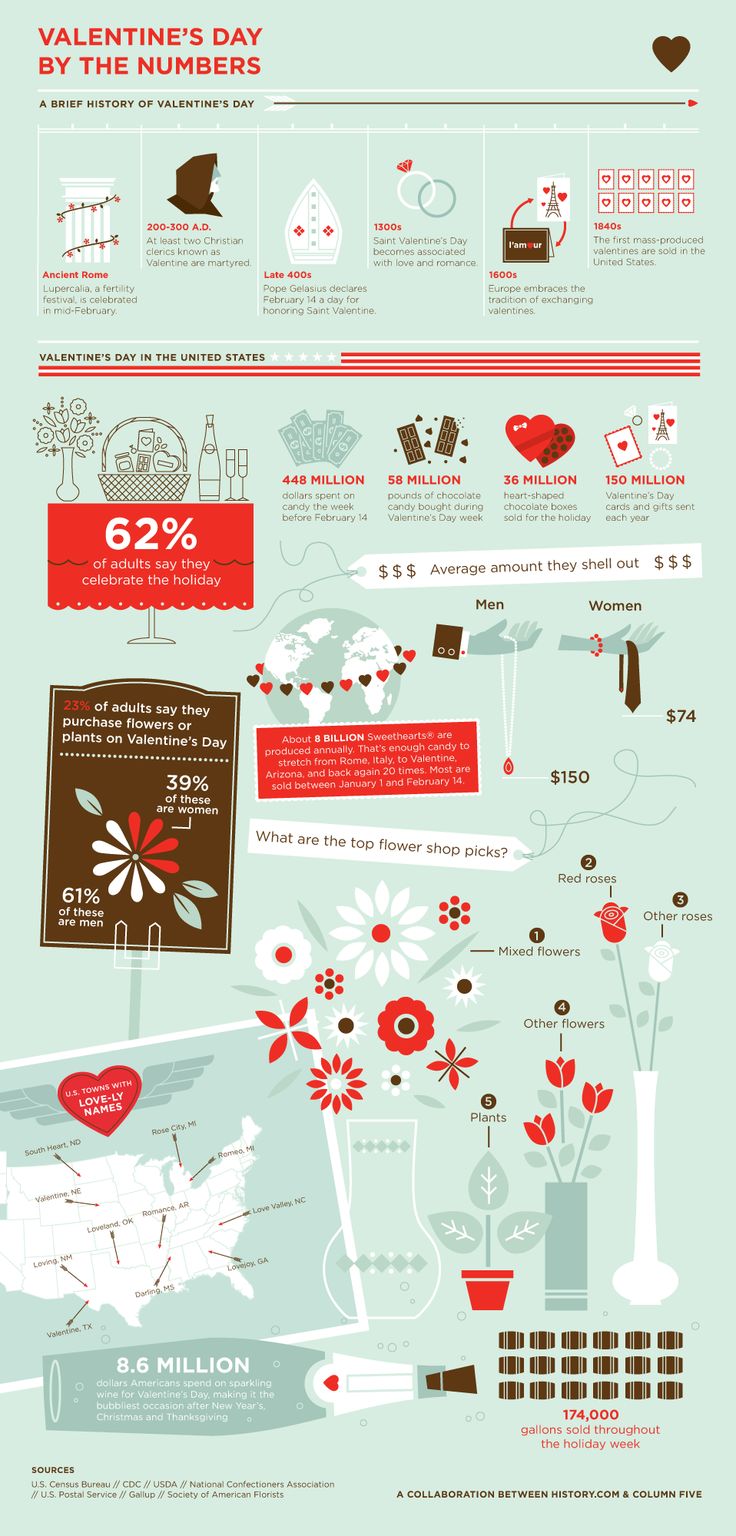
Valentine’s Day by the Numbers (INFOGRAPHIC)
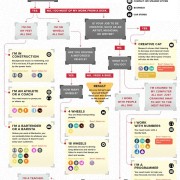
With Valentine’s Day less than a month away, we found ourselves wondering just how much is spent each year on the holiday of love. After a quick search, we stumbled on an INFOGRAPHIC from History.com and Column Five that details some of the numbers behind the holiday.
Among other highlights, some stats that stood out to us include:
- The most purchased flower shop pick for Valentine’s Day is mixed flowers.
- Men spend on average $150 each year, compared to women who spend $74
- 58 million pounds of chocolate are bought during the holiday
- 150 million cards and gifts are sent each year
Read more in the INFOGRAPHIC below:


Leave a Reply
Want to join the discussion?Feel free to contribute!